Are Instagram Stories still worth your time in 2026? The short answer is: absolutely yes — and the numbers prove it.
Since Instagram launched Stories back in August 2016 as a direct answer to Snapchat’s ephemeral format, the feature has grown into one of the most powerful content tools on social media. Today, Stories aren’t just a nice-to-have; they are the connective tissue between brands and their audiences, the format that drives direct messages, builds daily trust, and converts attention into real business outcomes.
Whether you’re a content creator optimizing your posting schedule, a marketer allocating ad budgets, or a brand manager reporting ROI to stakeholders, these 2026 Instagram Story view statistics give you the data you need to make smarter decisions.
Let’s dive in.
1. Instagram Stories: The Big Picture Numbers
Before zooming into the details, let’s establish the sheer scale of Instagram Stories in 2026.
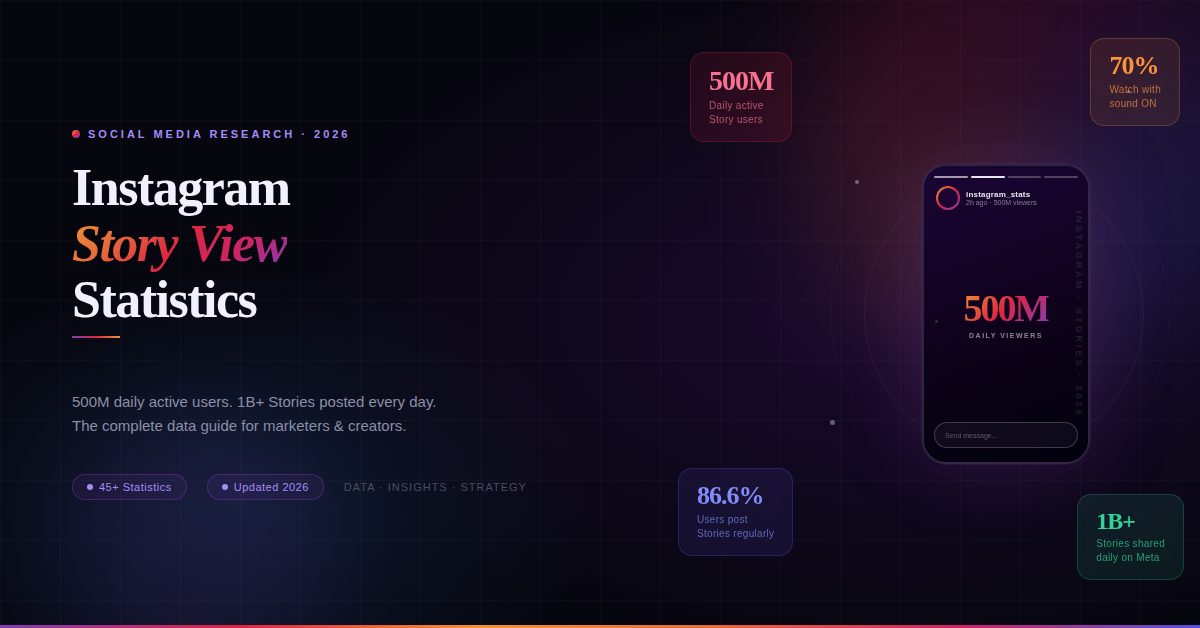
- 500 million people use Instagram Stories every single day. This figure has remained one of the most cited benchmarks in social media, originally disclosed by Meta and reaffirmed by Statista data through 2025.
- More than 1 billion Stories are shared daily across Meta’s family of apps — including Instagram, Facebook, and Messenger.
- Instagram itself now has over 3 billion monthly active users globally as of 2026, making it the fourth most-visited website in the world according to Sprout Social’s 2026 data.
- With 500 million daily Stories users against that 3 billion monthly base, roughly one in six monthly users engages with Stories on any given day — a staggering level of consistent feature adoption.
- An impressive 86.6% of Instagram users post Stories. This is no longer an early-adopter feature; it has become default content behavior for the platform’s user base.
These macro numbers cement one reality: if your audience lives on Instagram, they are almost certainly watching Stories.
2. Instagram Story View Rate & Reach Statistics
Understanding how many people actually see your Stories is crucial for benchmarking performance.
Reach vs. Feed Posts:
One of the most important contrasts in 2026 is the reach differential between Stories and traditional feed posts:
- Instagram Stories typically reach between 2% and 9% of a user’s followers per Story.
- Traditional feed posts, by comparison, reach 13% to 27% of followers.
This sounds discouraging at first glance, but context matters enormously. Stories are consumed in a dedicated, full-screen, intentional viewing environment. Users who click on your Story circle are actively choosing to see your content — making that 2–9% a highly qualified and engaged audience.
Daily Viewership Rate:
- 70% of Instagram users watch Stories every day, according to multiple sources including inBeat Agency and IZEA’s 2025 research.
- For accounts with larger followings (100K+ followers), viewership consistency is notably higher, with these accounts posting over 6x more Stories per month than smaller accounts, according to Hootsuite’s 2026 data.
Story Completion Rates by Frame Count:
Research from Socialinsider’s analysis of 161,180 Stories across account sizes reveals important findings about story length and completion:
- For a single-frame Story, the exit rate is approximately 8% — meaning 92% of viewers who start will complete it.
- Exit rates decline progressively for longer Stories, dropping to just 2% for Stories with 26 or more frames.
- The critical insight: 23.8% of viewers exit after the very first Story in a sequence. Those who stay past the second frame are significantly more likely to watch the entire sequence.
This data makes a powerful case for strong opening frames and consistent daily publishing.
3. Story Exit Rates & Drop-Off Data
Exit rate is one of the most actionable metrics available in Instagram Story analytics. Here’s what the 2026 data tells us:
- The highest drop-off point is the first Story — with approximately 12.99% of viewers exiting after frame one, according to data cited by SocialMediaCurve.
- This is followed by a 9.75% drop after the second Story frame.
- By the third frame, the drop-off decreases to 8.12%, and it continues to shrink as viewers who remain become more committed watchers.
Video vs. Image Exit Rates:
For accounts with between 10,000 and 50,000 followers, Socialinsider data shows:
- Video Stories average an exit rate of 10.5%.
- Image Stories average an exit rate of 9.3%.
While image Stories technically have a slightly lower exit rate, video Stories hold viewer attention longer overall, making them more effective for in-depth storytelling and product demonstrations.
Content Format Split:
Stories content in 2026 is split roughly 57% images and 43% videos, based on an analysis of over 161,000 Stories. This means there is still significant room to increase video usage — and given the engagement data, that shift could pay dividends.
4. Audience & Demographics Statistics
Knowing who is watching Stories helps you tailor content and targeting effectively.
- The 25–34 age group makes up the largest share of Instagram Stories users at 31.2% of the user base, according to Amra & Elma’s 2025 research.
- 80% of U.S. adults aged 18–29 use Instagram, making it especially critical for brands targeting Gen Z and Millennials, per Hootsuite’s 2026 report.
- 59% of Millennials prefer to watch Stories on Instagram specifically, versus 52% who watch on Snapchat.
- Gen Z consumers are highly active: 49% of Gen Z users say they use Instagram Stories to discover new products and services.
- Instagram’s worldwide user base skews slightly male globally (52.5% male, 46.5% female), though in the United States the breakdown reverses to 55.4% female.
The data consistently points to Instagram Stories as a Millennial and Gen Z-dominated space, with strong purchase-intent behavior among younger demographics.
5. Sound & Video Engagement in Stories
Unlike the feed experience, Stories are an audio-first environment — and this has major implications for content strategy.
- A remarkable 70% of Instagram Stories are watched with the sound ON, according to data from Socialinsider and multiple 2025/2026 research sources.
- This stands in sharp contrast to Facebook and other feed-based environments, where the majority of video views begin muted.
What This Means for Creators and Brands:
The sound-on majority means that music, voiceovers, dialogue, and audio branding are not optional embellishments — they are core storytelling tools. Content that relies on visual-only communication is leaving significant engagement value on the table.
Investing in audio elements, whether through licensed background music, branded jingles, or conversational voiceovers, can substantially increase the immersive quality of your Stories and align with how the majority of users are already consuming the content.
6. Business & Brand Story Statistics
For businesses considering whether Stories deserve a place in their social strategy, the data in 2026 is unambiguous.
- One-third of the most viewed Instagram Stories are created by businesses, not personal accounts. This indicates that audiences actively seek out and engage with brand content in the Stories format.
- 50% of brands globally post at least one Story per month — though the top-performing 25% of brands post Stories at least 16 times per month (roughly every other day), per Rival IQ research.
- There are over 200 million business profiles on Instagram, and approximately half of all users interact with at least one business account daily.
- 58% of users say they became more interested in a brand or product after seeing it in Stories, according to Hootsuite’s 2025 data. A related stat from inBeat Agency puts that figure even higher, at 62%.
- 50% of people visited a website to purchase a product they first saw in an Instagram Story — making Stories a direct conversion driver, not just a brand-awareness tool.
- 36% of businesses currently use Instagram Stories for product promotion. While this adoption rate is meaningful, it also reveals significant competitive opportunity: nearly two-thirds of businesses are not yet leveraging the format.
Daily Session Impact:
Instagram Stories have helped increase the average daily use of the platform to 28 minutes per day. The more time users spend in the app, the greater the organic and paid reach opportunity for brands present in the Stories feed.
7. Influencer Marketing & Stories
Stories have become a cornerstone format within the influencer economy.
- 55.4% of influencers use Stories for sponsored posts, making it the second most popular format for paid partnerships after feed posts, according to Hootsuite’s 2025 data.
- Nearly 50% of influencer marketing campaigns now incorporate Instagram Stories as a primary or supplementary deliverable.
- Mega-influencers (those with very large followings) charge upwards of $1,210 per Instagram Story post, reflecting the high perceived value brands place on this format.
- Between 15% and 25% of viewers swipe up on links included in branded Stories — a conversion rate that is remarkably high compared to most digital advertising formats.
- Accounts that combine daily Stories with growth-focused strategies grew followers 1.6x faster than accounts relying solely on feed posts, according to Outfame’s 2026 analysis of 65,000+ accounts.
8. Instagram Story Ads Statistics
Paid placements within Stories continue to be among the highest-performing ad units in the entire digital advertising ecosystem.
- Instagram Story ads reach more than 900 million users per month, making them one of the most expansive single-format ad placements available anywhere.
- In 2023 (the most recently published full-year figure), Instagram Stories ads generated $20.03 billion in revenue, and that figure is projected to grow as Instagram’s share of Meta’s total advertising revenue rises from 44% in 2022 toward an estimated 53%+ by 2026.
- Instagram Story ads achieve an 86% completion rate, meaning the vast majority of users who encounter a Story ad watch it through to the end — a testament to the immersive, full-screen format.
- 4 million advertisers across Meta’s platforms use Stories ad placements, with approximately 3 million using Stories across Facebook, Instagram, and Messenger simultaneously.
For performance marketers, the combination of massive reach, high completion rates, and strong swipe-up conversion rates makes Stories ads one of the most compelling placements in social media.
9. Key Story Metrics to Track in 2026
Instagram’s native analytics (available to business and creator accounts) now organizes Story metrics into three core categories. Here’s a breakdown of what each measures and why it matters:
Discovery Metrics:
- Reach — The estimated number of unique accounts that saw your Story.
- Views — Total number of times your Story was displayed (including repeat views). Note: Meta has replaced “Impressions” with “Views” as the primary metric.
- Profile Visits — How many viewers clicked through to your profile after watching.
- Follows — New followers acquired from Story viewers.
Navigation Metrics:
- Taps Forward — Viewers skipping to the next frame. High taps forward may indicate content that isn’t holding attention.
- Taps Back — Viewers rewatching a frame. This is a strong positive signal — something captured their attention enough to replay.
- Exit Rate — The percentage of viewers who left the Story rather than tapping forward. Monitor this per frame to identify weak spots.
- Swipe-Ups / Link Clicks — Direct conversion actions from your Story.
Engagement Metrics:
- Replies — Direct messages triggered by your Story. These are high-intent signals of genuine audience connection.
- Shares — How many viewers forwarded your Story to others.
- Sticker Taps — Interactions with polls, quizzes, question boxes, and other interactive elements.
- Likes — Double-tap reactions within Stories.
Tracking these metrics consistently over time — rather than looking at individual Story performance in isolation — is the key to building a data-driven Stories strategy.
10. Actionable Tips Based on the Data
The statistics above are only valuable if they translate into strategic action. Here’s what the 2026 data specifically recommends:
Hook hard in frame one. With 12.99% of viewers exiting after the first frame, your opening Story must deliver immediate value, intrigue, or visual impact. Don’t bury the lead.
Post consistently, ideally daily. Top-performing brands post 16+ times per month. Consistency keeps you in your audience’s Stories queue and builds habitual viewing behavior.
Invest in audio. Since 70% of Stories are watched with sound on, every Story you publish should have intentional audio — music, voiceover, or ambient sound at minimum.
Use video alongside images. The current 57/43 image-to-video split suggests most accounts are under-utilizing video. Given that video holds attention longer, shifting that balance toward 50/50 is a smart test.
Use interactive stickers strategically. Polls, quizzes, and question stickers don’t just boost engagement metrics — they generate audience insights and direct conversations that can inform your broader content strategy.
Include clear CTAs and links. With 15–25% swipe-up rates on branded Stories, every Story you publish for marketing purposes should have a clear call to action and, where possible, a direct link.
Keep Series under 7 frames for new audiences. The average number of frames per Story has declined year-over-year, and data shows significant drop-off in early frames. Shorter, punchier sequences tend to perform better for audiences who don’t yet have a strong relationship with your content.
Final Thoughts
The Instagram Story view statistics for 2026 tell a clear story of their own: this format isn’t fading. With 500 million daily active users, strong brand recall rates, robust ad revenue, and one of the highest sound-on viewing rates in all of social media, Stories remain essential for anyone serious about building a presence on Instagram.
The biggest opportunity revealed by this data? The gap between what’s possible and what most brands are actually doing. With only 36% of businesses actively using Stories for promotion, the early movers who commit to consistent, high-quality Stories content still have a real competitive advantage.
Use the statistics in this guide as your 2026 benchmark — and revisit them quarterly as Meta continues to evolve the platform.